Collaborative Market Analysis: How Betting Exchange Groups Tackle Live Volatility Patterns
Sage Lorenz · Jul 15, 2026
Collaborative Market Analysis: How Betting Exchange Groups Tackle Live Volatility Patterns
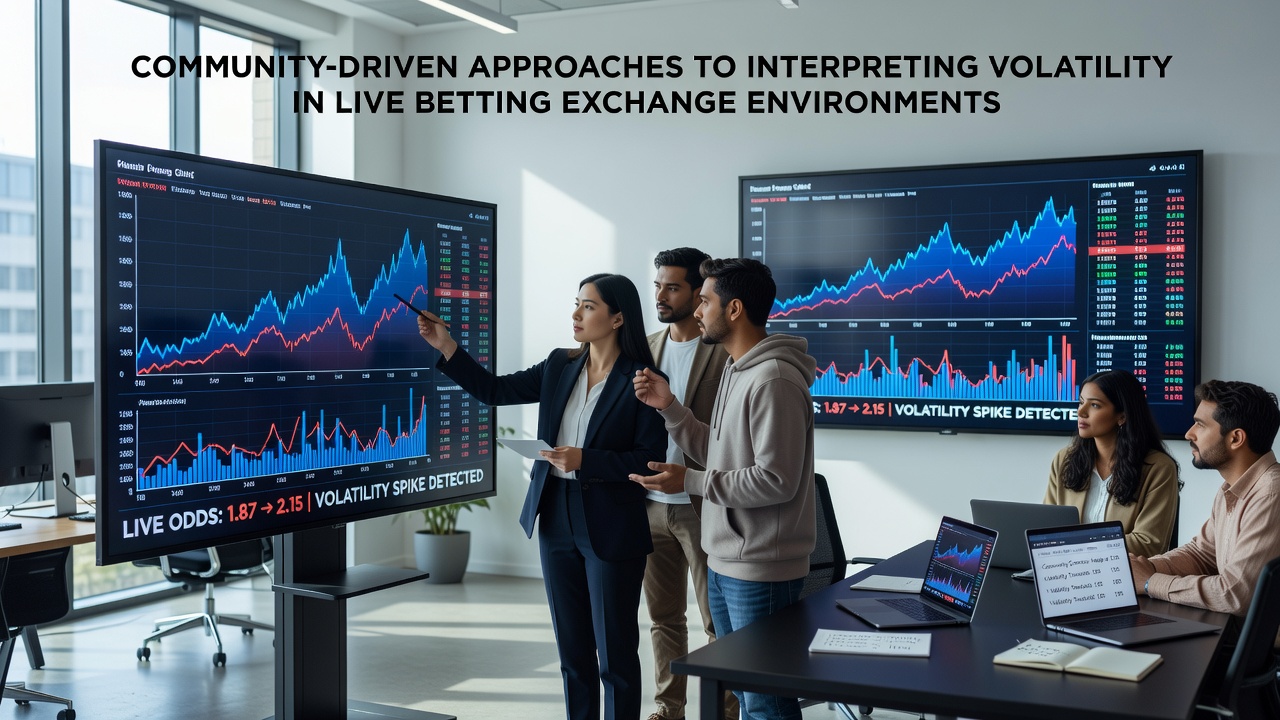
Live betting exchanges generate rapid price movements that reflect shifting probabilities during events, and participants increasingly turn to group discussions for context on those swings. Observers note that forums, chat rooms, and dedicated signal-sharing platforms allow traders to pool observations on liquidity changes, order flow imbalances, and sudden volume spikes across football, tennis, and cricket markets. Data from exchange operators shows these interactions often focus on identifying whether a volatility spike stems from new information or temporary liquidity gaps.
Researchers at academic institutions have examined how collective input affects decision speed in high-frequency trading environments, and similar dynamics appear in betting exchanges where users flag anomalies such as mismatched lay and back volumes. One study from an Australian university highlighted that groups using shared spreadsheets and real-time alerts reduced reaction times to volatility events by cross-referencing multiple data points simultaneously. Participants describe these networks as repositories of historical patterns that individual traders might overlook during fast-moving sessions.
Shared Data Sources and Signal Verification
Community platforms typically aggregate feeds from multiple exchanges alongside statistical databases, allowing members to compare implied probabilities against historical benchmarks. Figures from industry reports indicate that verified user contributions often include timestamps of key moments such as substitutions or weather shifts that influence in-play odds. Members frequently post screenshots of depth charts or use bots to broadcast alerts when certain thresholds, like a 15 percent swing in under two minutes, occur.
Verification processes within these groups rely on multiple confirmations before signals gain traction, and analysts have observed that threads with at least three independent sources tend to attract wider attention. This approach mirrors practices documented in research papers on crowd-sourced financial forecasting, where aggregated inputs improve accuracy over isolated judgments. Traders note that July 2026 saw increased activity in European summer tournaments, with groups compiling datasets on heat-related performance variances that correlated with late-match volatility.
Regional Variations in Community Practices
Approaches differ by geography because regulatory frameworks shape available tools and data transparency. In jurisdictions overseen by bodies such as the Nevada Gaming Control Board, participants emphasize compliance-focused discussions around record-keeping for volatility trades. Meanwhile, groups in Asia-Pacific regions reference reports from the Australian Communications and Media Authority when evaluating cross-border exchange liquidity patterns.
European collectives often incorporate metrics from the European Gaming and Betting Association to contextualize seasonal fluctuations, whereas North American forums lean on state-level enforcement data for interpreting regulatory impacts on market depth. These differences lead to distinct signal types, with some communities prioritizing volume-based indicators and others focusing on implied probability deviations.

Tools and Techniques for Volatility Interpretation
Software integrations shared within communities range from custom scripts that track order book imbalances to dashboards that overlay multiple event timelines. Participants report that combining exchange APIs with external weather or injury databases helps isolate external drivers of price movement. A 2025 industry analysis found that groups maintaining version-controlled repositories of past volatility episodes achieved higher consistency in labeling events as information-driven versus noise-driven.
Techniques include threshold alerts triggered by percentage changes in matched volume and comparative analysis against similar historical fixtures. Observers have documented cases where collective review of order flow revealed spoofing attempts that individual screens missed, prompting broader alerts across the network. These methods rely on active participation rather than passive consumption, with contributors expected to provide evidence alongside claims.
Challenges in Maintaining Group Effectiveness
Noise from unverified claims remains a persistent issue, and experienced members describe filtering mechanisms such as reputation scoring or required proof uploads to maintain signal quality. Research indicates that groups without structured moderation experience higher rates of conflicting advice during peak volatility periods. Coordination across time zones also affects real-time utility, since major events often occur when key contributors are offline.
Some networks address this through rotating shift coverage and archived summaries that new members can review. Data shows participation peaks around major tournaments, with July 2026 activity levels rising notably during concurrent cricket and tennis schedules. Sustaining engagement requires clear contribution guidelines that separate raw data from interpretive commentary.
Conclusion
Community-driven methods for interpreting volatility continue to evolve alongside exchange technology and data availability. Groups that emphasize verification, diverse data sources, and structured sharing produce outputs that individual traders incorporate into live decision processes. Regulatory developments across regions will likely influence the scope and format of these collaborations in coming periods, yet the core practice of pooling observations persists as a documented feature of modern exchange environments.