Decoding Market Rhythms: How Performance Data Fuels Adaptive Strategies in Exchange Trading Circles
Xander Carter · Jun 20, 2026
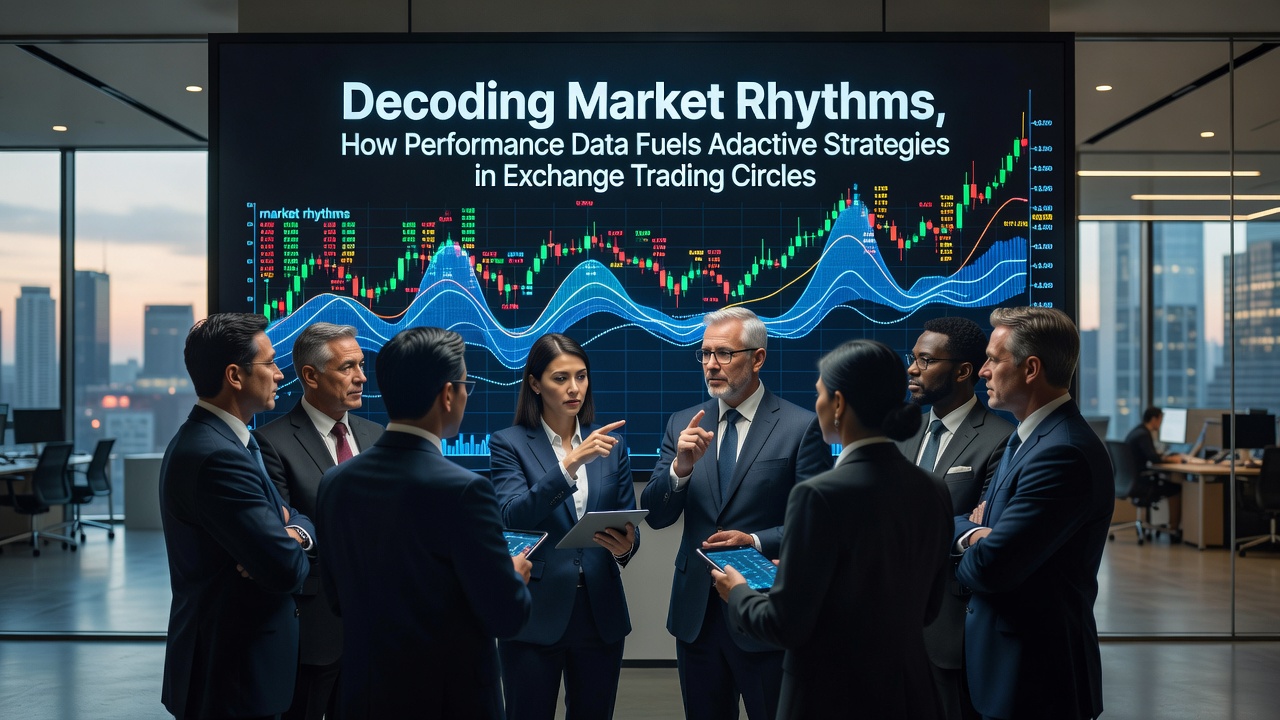
Decoding Market Rhythms: How Performance Data Fuels Adaptive Strategies in Exchange Trading Circles
Exchange trading circles operate through networks of participants who monitor live markets on betting exchanges and refine positions based on incoming performance indicators rather than static forecasts alone. These circles draw on datasets that track player output, team consistency, and historical price movements to detect repeating sequences in how odds respond to unfolding events. Data arrives from multiple feeds that aggregate results across past matches or races so traders can map rhythms where certain metrics correlate with rapid shifts in available liquidity.
Mapping Recurring Patterns in Market Behavior
Performance data reveals cycles where specific statistics align with predictable liquidity surges or contractions, allowing groups to anticipate when a market might tighten or widen. Observers note that metrics such as strike rates under particular conditions or recovery times after setbacks frequently precede adjustments in order flow. Circles compile these indicators into shared dashboards that highlight deviations from established baselines, giving members time to reposition before broader participation reacts. Research indicates that consistent tracking of these variables across multiple events produces clearer signals than isolated snapshots, because patterns emerge only when datasets span comparable scenarios over extended periods.
Integrating Real-Time Inputs with Historical Benchmarks
Adaptive strategies form when traders cross-reference live updates against archived performance records to decide whether current conditions match prior instances that produced measurable edges. Software platforms pull in both streams simultaneously so participants can flag mismatches quickly and alter exposure levels accordingly. One study revealed that groups maintaining layered datasets reduced response times during volatile periods because members already understood how similar statistical profiles had behaved previously. Those who've studied this process find that the combination of granular player data with order-book history creates feedback loops where each new data point refines the next decision threshold.
Community Tools That Process Performance Streams
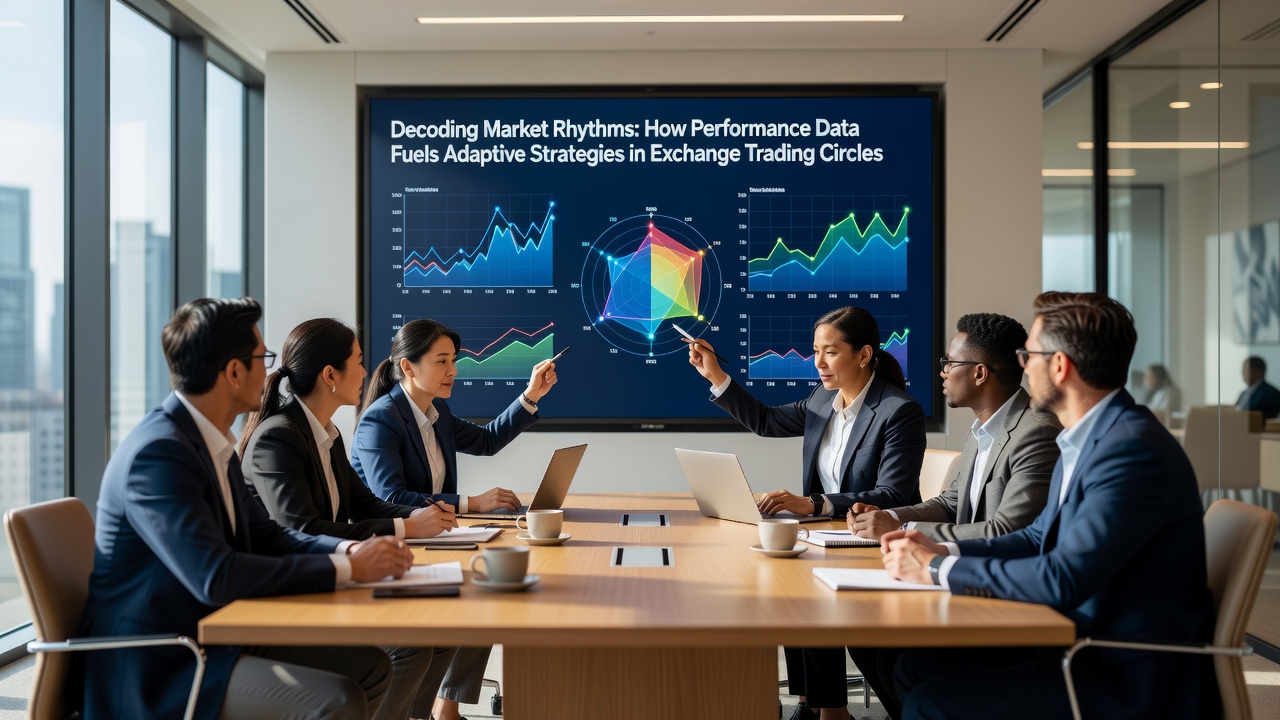
Trading circles deploy custom interfaces that ingest performance statistics from official event records and overlay them onto exchange price histories in a single view. Members contribute parsed outputs from past sessions so the collective repository grows with each completed fixture, strengthening the reference set for future comparisons. Data shows that circles using these aggregated resources identify inflection points earlier than individuals working from separate sources, since shared validation catches anomalies faster. What's interesting is how these systems handle incomplete datasets by weighting available metrics according to historical reliability rather than discarding partial records outright.
Adjusting Positions Through Data-Driven Thresholds
Adaptive approaches rely on predefined triggers derived from performance distributions, such as when a participant's output exceeds or falls short of seasonal averages by defined margins. Traders then scale exposure or hedge accordingly while the market still offers favorable entry points. According to figures from the Canadian Gaming Association, operators tracking similar statistical overlays reported measurable shifts in liquidity patterns during peak periods in early 2026. Circles apply these thresholds consistently because repeated application across varied events builds confidence in the underlying relationships between data points and price movement.
Developments Observed Through Mid-2026
By June 2026, several circles had expanded their datasets to include granular tracking from newly introduced leagues and tournaments, increasing the sample sizes available for rhythm analysis. Performance records from these additions allowed participants to test whether established patterns held under different competitive structures. Reports compiled by the Australian Gambling Research Centre noted parallel growth in data-sharing practices among exchange users seeking to refine timing models. The expanded coverage meant strategies could account for regional variations in how markets absorbed performance surprises, producing more robust adaptation rules.
Conclusion
Performance data serves as the core input that lets exchange trading circles detect market rhythms and implement adaptive strategies with measurable consistency. Continued aggregation of historical and live metrics across expanding event calendars supports ongoing refinement of decision frameworks. Circles that maintain disciplined integration of these streams sustain their operational edge through systematic comparison rather than reactive adjustments alone.