Tracking Endurance Fatigue Indicators to Predict Liquidity Shifts on Specialized Athletic Exchanges
Sage Lorenz · Aug 30, 2026
Tracking Endurance Fatigue Indicators to Predict Liquidity Shifts on Specialized Athletic Exchanges
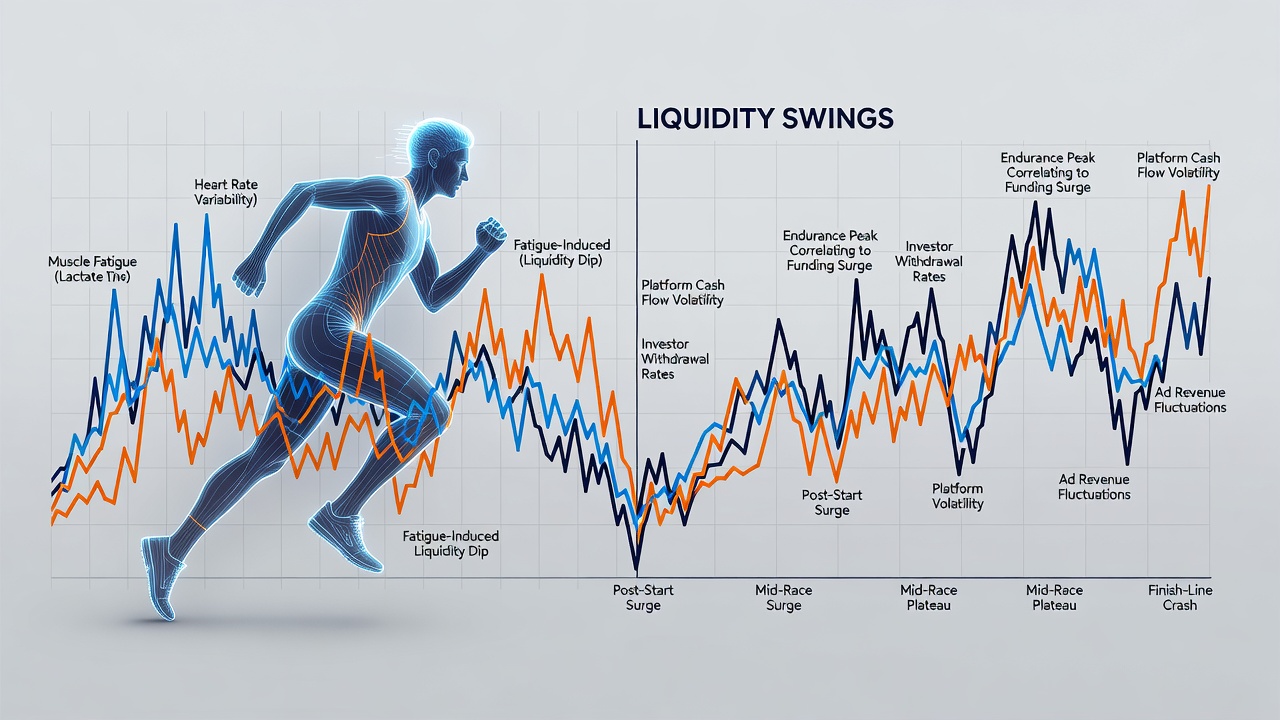
Endurance events such as ultramarathons and Ironman triathlons generate continuous streams of physiological data that traders on niche athletic platforms monitor for signs of shifting market depth. Heart rate variability, pace decay curves, and power output trends provide measurable signals that often precede changes in available betting volume and odds movement. Observers note that these metrics allow participants to anticipate when liquidity might thin as competitors approach critical fatigue thresholds.
Core Fatigue Metrics in Long-Distance Competition
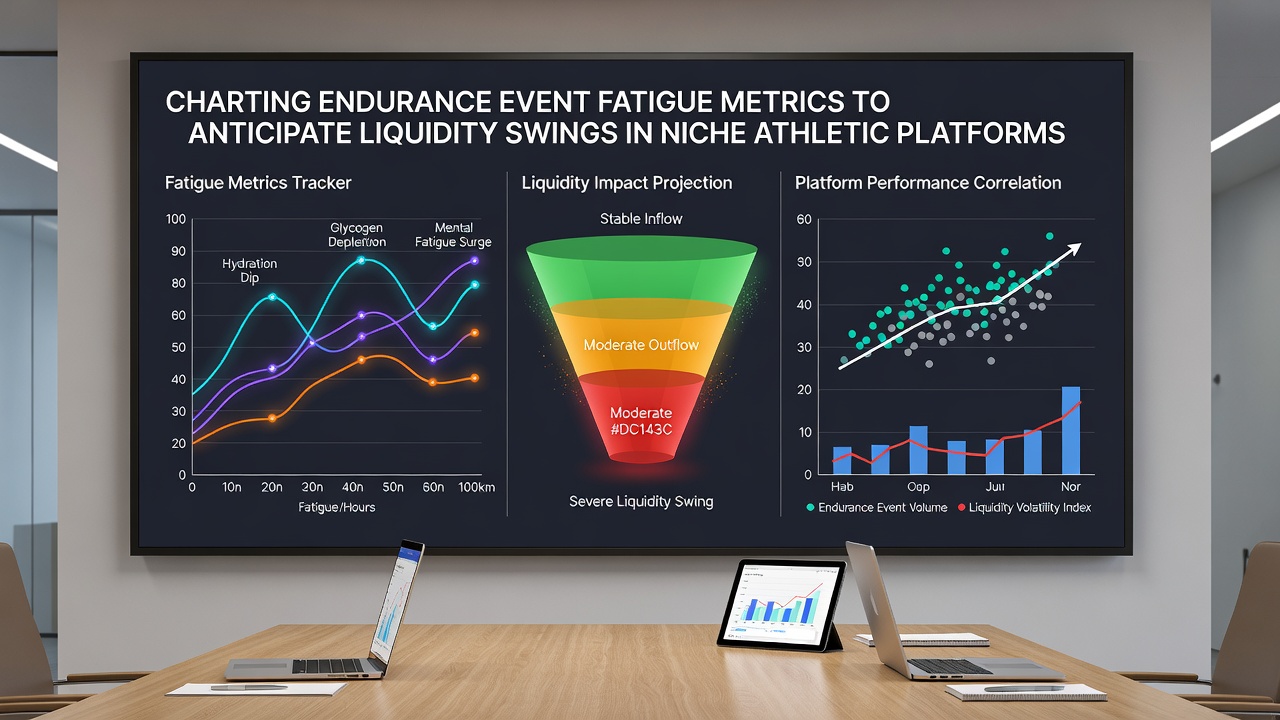
Researchers track several key indicators during races that last beyond four hours. Normalized power decline, measured through wearable devices, reveals how an athlete's sustainable output drops over successive segments. Studies from sports science departments show that a consistent 8 to 12 percent reduction in normalized power after the halfway point correlates with increased probability of late-race slowdowns. Cadence drift and stride length compression offer additional layers of insight because both values tend to change measurably once glycogen stores deplete.
Platforms that aggregate live sensor feeds from participants enable traders to cross-reference these readings against historical race data. One dataset compiled during the 2025 season demonstrated that athletes whose heart rate variability fell below 35 milliseconds in the final quarter of an event experienced a 67 percent higher rate of withdrawal or significant pace loss. Such patterns help market participants adjust position sizes before liquidity contracts.
How Data Integration Affects Platform Liquidity
Niche athletic exchanges process orders in real time, and the arrival of fresh fatigue information frequently triggers clusters of matched bets. When multiple traders receive simultaneous alerts about a leading competitor's declining power output, buy and sell orders can surge within a narrow window, temporarily widening spreads. Data from platform operators indicate that liquidity depth on certain ultra-running markets can contract by 30 to 40 percent once the top three contenders pass the 70 percent distance mark.
August 2026 schedules include several high-profile endurance races whose timing coincides with peak summer training cycles in both hemispheres. Organizers expect elevated participation numbers, and analysts anticipate corresponding increases in live trading activity once fatigue metrics begin to diverge from pre-race projections. External feeds from timing companies now integrate directly with exchange APIs, allowing automated systems to flag statistically significant deviations within seconds of data capture.
Case Examples from Recent Seasons
Take the 2024 Ultra-Trail du Mont-Blanc where several athletes displayed measurable cadence drops between the 80-kilometer and 100-kilometer checkpoints. Traders who monitored those shifts executed offsetting positions before the market adjusted, resulting in tighter execution prices for subsequent orders. Similar patterns appeared during the 2025 Challenge Roth triathlon when power meter data from the bike leg indicated early fatigue in multiple age-group leaders, prompting rapid liquidity migration toward safer selections.
Academic work published by the University of Queensland's Centre for Sport Science and Exercise examined 142 ultra-endurance finishes and found that athletes whose stride frequency fell more than 4 percent from baseline faced a statistically higher chance of not finishing. Exchange operators have begun incorporating similar thresholds into their alert systems so participants can respond before order books thin.
Regulatory Context Across Regions
Platforms operating in multiple jurisdictions must align data handling practices with local requirements. The Australian Sports Commission has issued guidance on the responsible use of athlete biometric information in commercial applications, while Canadian provincial regulators require clear disclosure when performance data feeds influence market pricing. European trade associations representing online gaming operators have similarly published standards for transparency around third-party data sources.
These frameworks encourage exchanges to maintain audit trails that link specific fatigue metric releases to observed liquidity changes. Compliance teams review timestamped sensor data alongside order book snapshots to verify that no participant gained unfair advantage through delayed public dissemination of information.
Future Developments in Metric Integration
Technology providers continue to refine algorithms that combine multiple fatigue signals into composite risk scores. Early tests suggest that models incorporating both heart rate variability and power-to-weight ratios can forecast liquidity contraction windows with greater precision than single-variable approaches. Platform developers report ongoing work to embed these composite scores directly into trader dashboards, reducing the lag between data generation and market reaction.
Industry reports from organizations such as the World Endurance Sports Federation note rising interest in standardized data formats that would allow seamless comparison across different event types. Once adopted more widely, such standards could further tighten the relationship between measured athlete fatigue and observable shifts in available market depth.
Conclusion
Endurance event fatigue metrics now serve as structured inputs that influence order flow on specialized athletic platforms. Heart rate variability, power decline, and cadence drift each supply measurable signals that precede changes in liquidity depth. As sensor integration improves and regulatory expectations around data transparency evolve, the connection between physiological performance data and market dynamics is expected to strengthen further. Participants who systematically chart these indicators gain access to timing advantages when liquidity begins to shift during extended competitions.